•
24-minute read


As an SEO, one has to deal with a mass of data from different analytic tools. They help track and analyze all the necessary metrics that show your project's performance. The inconvenience is that they provide siloed data. And you may overlook important details, as you don't see a complete picture of your project.
Being an SEO myself, I've come to the necessity of having an SEO dashboard where I could have all the data I track in a single space. In my work, I use different tools, including Google Analytics, Google Search Console, and Rank Tracker.
Download Rank Tracker
I believed it could help me better assess the state of the project, its success or failure. It could also show potential growth opportunities and trouble spots, and help find possible reasons behind sudden ranking drops. Moreover, I needed to overcome the common Google Analytics limitation that involves hiding converting keywords behind the (not set) mark.
From this article, you will learn to integrate data from Rank Tracker, Google Search Console, and Google Analytics into Google Data Studio and aggregate it in a single SEO dashboard. You'll also see how to discover those (not set) converting keywords from Google Analytics.
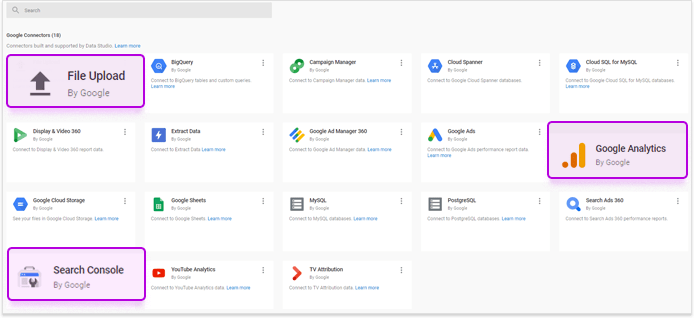
Google Data Studio is a reporting tool. Users can visualize the data through graphs and create tables with calculated fields. Data sources are added through various connectors. Apart from Google products (such as Ads, Analytics, Search Console, etc.), you may connect third-party tools and services as data sources. The tool also allows for combining data from different sources. Thus users may consolidate and analyze all the necessary data in a single space, choosing one of Google Data studio dashboard templates or creating a custom dashboard.
This enables to see a much clearer picture of a project. And helps define further steps and improvement tactics.
Let's try to create a working SEO dashboard in Data Studio, containing different pages with graphs, tables, charts, filters, etc.
To start using Data Studio, you first need to connect some data sources to it. In my example, I'll be using three different sources of SEO data to create the dashboard:
Like mentioned before, there are various connectors in Data Studio through which data sources are added. I'll be using three of them. The corresponding connectors for Analytics and Search Console, and the File Upload for the data from Rank Tracker. (The latter will need some prearrangement, I'll come to it in due time.)
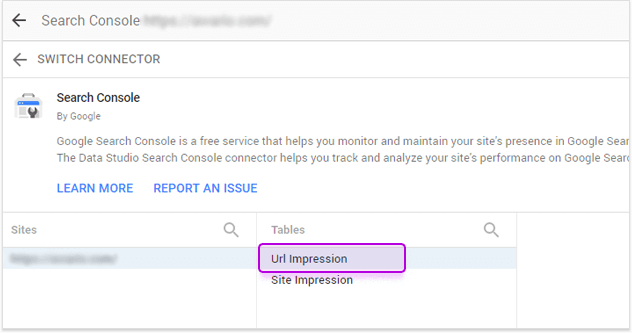
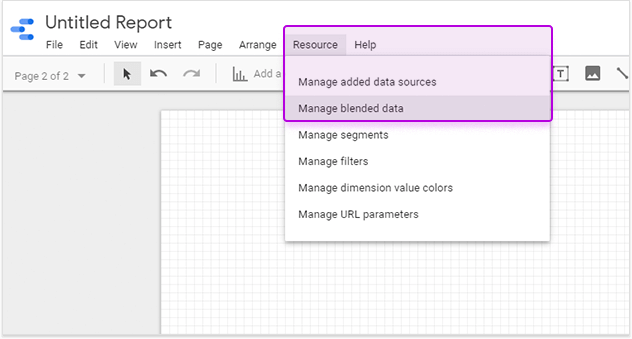
Let's add Google Search console as the first data source for the future SEO dashboard.
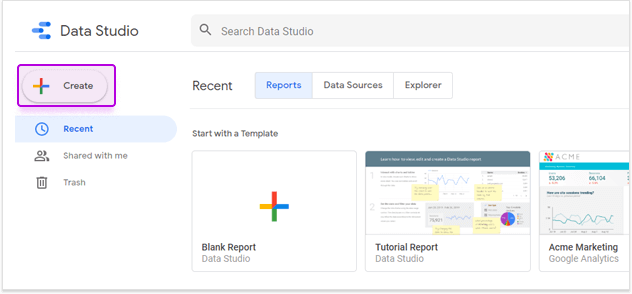
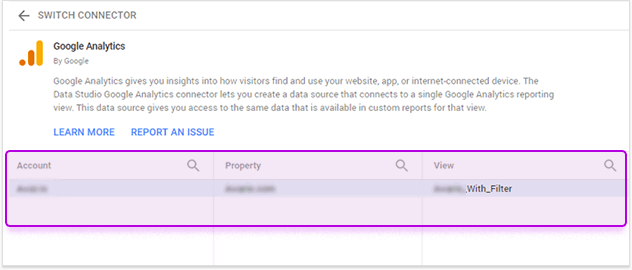
Let's get back to the homepage and add the second data source.
I'm interested in comparing my website's ranks against those of my competitors'. The search Console module in Rank Tracker provides this information. But the available for analysis time range is limited to a month. In Rank Tracker, however, it's possible to save rank tracking history. It is handy If I want to track the ranks at runtime. Search Console itself doesn't share this information with Data Studio. Thus, I need the data integrated into Data Studio from Rank Tracker.
Apparently, there's no connector for Rank Tracker in Data Studio. So we'll apply an elegant technical solution :). I mean, we'll export the necessary data and add it to Data Studio through the File Upload connector.
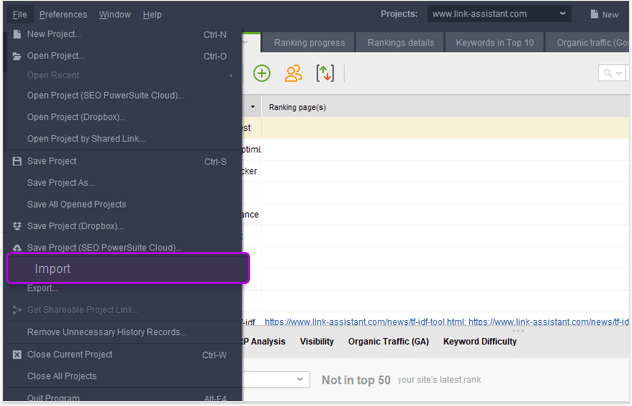
1. Export Rank Tracker data
Text CSV File as the export format
Comma as a delimiter
Export rankings historical data in Keyword Data Settings, (tick Include competitors if you need to export your competitors' data as well)
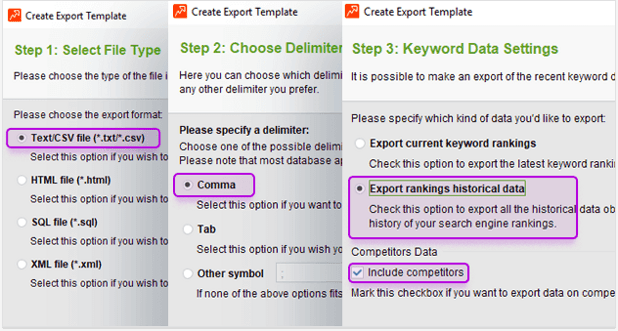
A little note. You may have already exported data from Rank Tracker. If so, at the first step you'll be asked to choose the export template from the list (you probably have some). In this case, click the Add button to create a new template.
Replace the contents of the screen with the sample below. (Don't ask howI got it. It was a cut-and-try method.) Then finish the export process.
<[DEFINE name="dateFormat" value="exportData.createDateFormat('M/d/YYYY')"/]>

<[DEFINE name="keywords" value="exportData.keywords"/]>

<[DEFINE name="searchEngines" value="exportData.searchEngines"/]>

<[DEFINE name="competitors" value="exportData.competitors"/]>

<[DEFINE name="ENTERED_VALUE" value="2147483647"/]>

<[DEFINE name="DROPPED_VALUE" value="-2147483646"/]>

<[DEFINE name="NOT_RANKED_VALUE" value="-2147483647"/]>

<[DEFINE name="NOT_CHECKED_VALUE" value="-2147483648"/]>

Keyword,SearchEngine,Check Date,Rank <[ECHO text="exportData.project.getShortName()"/]>,<[FOR_EACH name="competitors" id="competitor"]>Rank <[ECHO text="competitor.getShortName()"/]>,<[/FOR_EACH]>URL Found <[ECHO text="exportData.project.getShortName()"/]>, Landing Page <[ECHO text="exportData.project.getShortName()"/]>,<[FOR_EACH name="competitors" id="competitor"]>URL Found <[ECHO text="competitor.getShortName()"/]>,<[/FOR_EACH]>

<[FOR_EACH name="keywords" id="keyword"]>

<[FOR_EACH name="searchEngines" id="searchEngineType"]>

<[DEFINE name="history" value="keyword.getHistory(searchEngineType)"/]>

<[FOR_EACH name="exportData.reverse(history)" id="historyRecord"]>

<[ECHO text="keyword.query"/]>,<[ECHO text="searchEngineType.getName()"/]>,"<[ECHO text="dateFormat.format(historyRecord.checkDate)"/]>",<[DEFINE name="position" value="exportData.getPosition(historyRecord)"/]><[IF condition="position != null"]><[THEN]><[IF condition="position=='Not in top 50'"]><[THEN]><[ECHO text="100"/]><[/THEN]><[ELSE]><[ECHO text="position"/]><[/ELSE]><[/IF]><[/THEN]><[/IF]>,<[FOR_EACH name="competitors" id="competitor"]><[DEFINE name="competitorHistoryRecord" value="exportData.getKeywordPosition(competitor, keyword, searchEngineType, historyRecord)"/]><[IF condition="competitorHistoryRecord != null"]><[THEN]><[DEFINE name="position" value="exportData.getPosition(competitorHistoryRecord)"/]><[IF condition="position != null"]><[THEN]><[IF condition="position=='Not in top 50'"]><[THEN]><[ECHO text="100"/]><[/THEN]><[ELSE]><[ECHO text="position"/]><[/ELSE]><[/IF]><[/THEN]><[/IF]><[/THEN]><[/IF]>,<[/FOR_EACH]><[IF condition="historyRecord != null"]><[THEN]><[ECHO text="historyRecord.url"/]>,<[ECHO text="exportData.formatLandingPage(keyword.getLandingPage())" suppressEncoding="false" formatType="CSV" formatedTextType="URL"/]><[FOR_EACH name="competitors" id="competitor"]><[DEFINE name="competitorHistoryRecord" value="exportData.getKeywordPosition(competitor, keyword, searchEngineType, historyRecord)"/]>,<[IF condition="competitorHistoryRecord != null"]><[THEN]><[ECHO text="competitorHistoryRecord.url"/]><[/THEN]><[/IF]><[/FOR_EACH]><[/THEN]><[/IF]>

<[/FOR_EACH]>

<[/FOR_EACH]>

<[/FOR_EACH]>
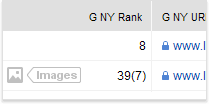
You might need to eliminate a couple of inconsistencies, in particular: Several cells may contain “Not in Top 100”, which means your website is out of the first hundred results. Change the text in such cells to a numeric value. I changed it to 100 Several cells in the Rank columns may contain values in brackets. This means that your website, apart from organic results, is shown in one of the search features (such as images, local pack, etc.). Just eliminate the value in brackets, and brackets, of course.
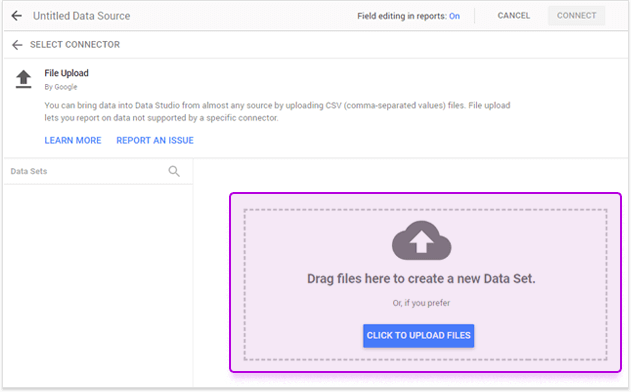
2. Select Upload File from the list of Data Studio connectors and upload the Rank Tracker export file.
3. Ensure that all the data fields were identified correctly.
4. For all the Rank strings, set the Aggregation as Average.
Having all the necessary data sources added to Data Studio, we can combine the data from these sources in a variety of analytic tables. We can base them either on the data from a single source or several sources combined. Data Studio allows for mixing up to five data sources in a single visualization.
To reach my goals, I'll need to analyze the data from different sources mixed in various combinations. So I will need to blend data.
There's a peculiarity you need to take into account. Blending data in Data Studio is a left outer join operation. It means that the table you create will be based on the records of the first data source you add to the blend. So depending on what metrics you need to analyze, consider placing the appropriate data source on the left in the blend row.
Add the necessary data sources. As an example, I'll add all three: Rank Tracker, Google Search Console, and Google Analytics.
| URL Rank Tracker | URL Search Console | URL Google Analytics |
| https://site.com/page-1 | https://site.com/page-1 | /page-1 |
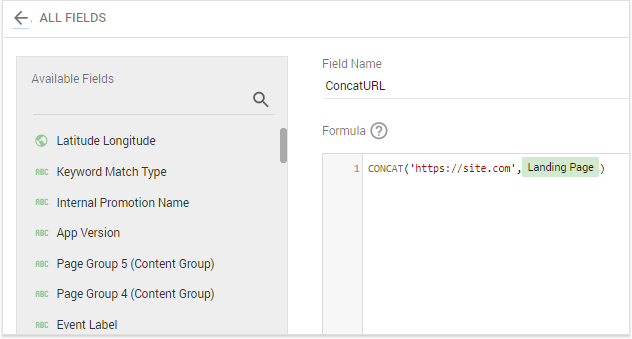
CONCAT('https://site.com',Landing Page)
We've created a calculated field that will be turning relative URLs to absolute. Thus all three keys will match.
When everything is configured correctly, Data Studio may be able to blend the data.
Let's take a closer look at all these Dimensions, Metrics, Filters, etc. needed for each data source.
Rank Tracker:Keywords — target keywords from Rank Tracker
TypeOfKeyword — defines the type of keyword (I'll come to it a bit further)
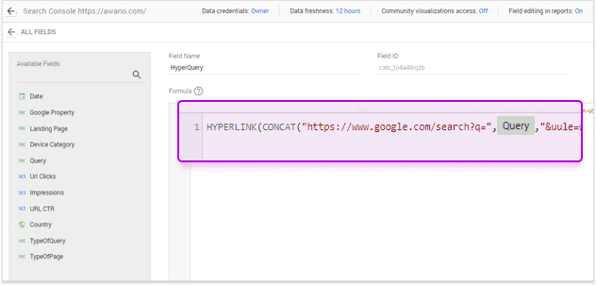
HyperKeyword — makes a keyword a hyperlink. See how to do this below:
Knowing the SERP for a certain keyword might be quite helpful to define whether to target the keyword or what page to optimize for it. So let's make all the keywords hyperlinks to corresponding SERPs.
HYPERLINK(CONCAT("https://www.google.com/search?q=",Query,"&uule=w+CAIQICIfTmV3IFlvcmssTmV3IFlvcmssVW5pdGVkIFN0YXRlcw==&hl=en-US&cl=US"),Query)
Let's break it down:
HYPERLINK means you're creating a hyperlink.
CONCAT helps put together all the parts of the target URL.
Query — the query you'll see the SERP for.
&uule=w + introduces the tracking region code. (In my example, its the US, you may set up another region if necessary. Check out how to encode the region)
Query — the query will be used as the anchor text.
Landing Page — a page that had impressions in Google
Google Property — the type of search (web, images, etc.)
TypeOfQuery — defines the type of keyword
ConcatURL — a calculated absolute URL
Medium Filter — the filter that will cut off all results except for organic
Now, as we know how to blend data, we can start inhabiting the dashboard with a variety of analytic tables.
To ensure an SEO campaign is effective, it's critical to regularly analyze the efficiency of your target keywords.
This information will timely prevent me from wasting my time on inefficient keywords and help find out some great keyword ideas. Analyzing my competitors' content, I may find ways to improve my pages and thus be able to improve my ranks. For a comprehensive analysis, I need to gather all this data in a single place.
I will need the data on clicks, impressions, and CTR from Google Search Console. So I will base my keyword efficiency analysis table on the data from this tool. And I usually use Rank Tracker to track my positions for target keywords and those of my competitors. Thus, I'll blend the data from these sources in the first two tables I'm adding to my dashboard.
Dimensions:
Metrics:
Dimensions:
Metrics:
Dimensions:
Metrics:
Mind that Average should be set up for every Rank metric, as well as for URL CTR. Click a small sign near the metric's name and choose the necessary setting. URL Clicks and Impressions should be marked as SUM.
The first table is ready. It will give you a bunch of useful insights on the efficiency of the keywords you track.
The table may contain loads of data, so it would be much more convenient to analyze it page by page. Click on the Landing page filter box and click Only next to the page you want to analyze.
The URL MySite column on the screenshot shows which pages rank for certain queries. (Originally, the column was named Landing page [my site name], but I renamed it to shorten a bit.)
If you arrange the table by this column in ascending order, you may see the null value in the column cells. This means, you don't track these keywords, but your website ranks for them, and there were site impressions and clicks. Thus, if the keyword is relevant to your page, and there are many impressions for it, you may consider adding it to your campaign.
Based on the data from Google Search Console, the table has one drawback. It shows the keywords you track (and don't track) if your site appears in search for them.
But what if you target keywords nobody looks for? To see whether you have them, you need to rearrange the data sources used to create the table. This will give you a different view angle, as the table will base on the data from Rank Tracker, and show you all the target keywords with no regards to clicks or impressions. But as we want to see the whole picture, we better create another table.
Click on the Impressions column heading to arrange the table results in ascending order. If you see null values for Impressions and Clicks, you probably target keywords that nobody searches.
Checking one of the keywords in Google Ads Keyword Planner, showed 10-100 estimated searches a month for it. However, as you can see, I had no site impressions for this keyword at all.
The page's low rank might have caused the lack of impressions. So try and track the keyword in progress. If there's no upward movement in impressions within a significant period, you're probably wasting your time on this keyword. (If only the keyword isn't seasonal.)
If your position for a keyword is high, but you still have no impressions, the keyword is doubtlessly useless.
Understanding what types of keywords your pages rank for can tell you whether you're putting efforts into the right things.
You know, that there are different intents behind keywords. So if someone types buy ice cream, it's definitely a transactional keyword that bears an intent to buy. In case it's what color is ice cream, the intent is informational. You got the point. Your specific pages must rank for the keywords of appropriate types.
It is obvious that for commercial websites, transactional queries at large generate the revenue. And the growth of branded requests will be evidence of successful advertising activities, online or offline. For a website having a blog, informational requests will also be of great interest.
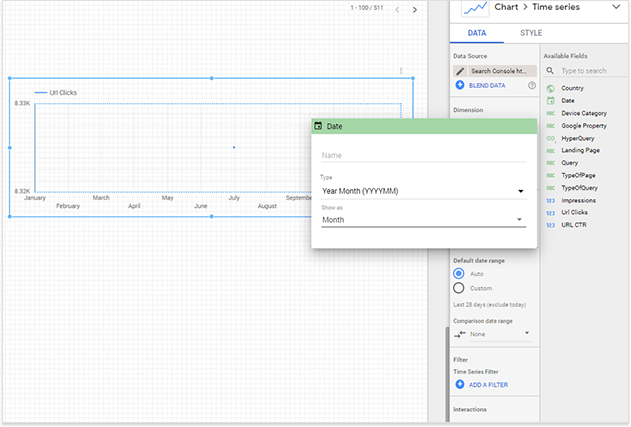
So let's define what type of queries bring traffic to the website. We'll create another table and a chart that will help visualize the data better.
First, we need to add a custom field to the data source.
CASE

WHEN REGEXP_MATCH(Query,"(.*can.*|.*how.*|.*is |.*what.*|.*when.*|.*why.*)") THEN "HTD"

WHEN REGEXP_MATCH(Query,"(.*brand_1.*|.*brand_2.*|.*brand_3.*)") THEN "brand"

WHEN REGEXP_MATCH(Query,"(.*prouct_1.*|.*prouct_2.*|.*prouct_3.*|.*prouct_4.*|.*prouct_5.*)") THEN "product"

ELSE "Other"

END
*Fill your brand name variations instead of the brand_1, etc.
*Fill in the types of products or services you provide, as well as all kinds of transactional modifiers, such as buy, near me, order, etc.
Thus, we can analyze search queries of what type bring me traffic. In my example, the largest amount of traffic falls on queries related to the brand name. This means that I have a lot of work to do. Because I need to increase the amount of traffic I receive from transactional keywords – the traffic that greatly impacts revenue.
It might be also interesting to group pages by their types and analyze the traffic different sections of your site receive. Moreover, it's necessary to track the traffic growth and drops at runtime. It would also be handy to know what type of queries caused the fluctuations and ranks of what type of pages drop. And knowing whether your competitors' average positions for such requests also changed may hint you at probable reasons for the change. Was it solely your website issue, or maybe there was another Google update that changed the landscape?
So, we'll need to create a table and a couple of charts to visualize this sort of necessary data.
Let's first group website pages by their types.
In general, there are different sections of a website, and each may include pages of the same type. For example, product pages, or services, blog pages, news pages, etc. The table will show how traffic splits up between different sectors of a website. Moreover, it will help analyze the effectiveness of your SEO efforts. You'll be able to see what types of keywords bring the largest part of traffic to your website, and what pages receive the largest part of the traffic. For example, if your product pages get the majority of traffic from, let's say brand queries, this may mean you're not reaching new users. This may be a signal to review your optimization tactics.
The process will be just the same as described previously. The formula for the field will be different, however.
CASE

WHEN REGEXP_MATCH(Landing Page,('https://site.com/product-page-1/|https://site.com/product-page-2/|https://site.com/product-page-3/')) THEN "product_pages"

WHEN REGEXP_MATCH(Landing Page,('https://site.com/blog/.*|https://site.com/blog/')) THEN "Blog"

WHEN REGEXP_MATCH(Landing Page,('https://site.com/compare-page-1/|https://site.com/compare-page-2/|https://site.com/compare-page-3/')) THEN "compare_pages"

WHEN REGEXP_MATCH(Landing Page,('https://site.com/reports/.*|https://site.com/reports/')) THEN "reports"

ELSE "Other"

END
*Make sure to enter your website pages instead of site.com examples.
Now you can see how your traffic splits between different types of pages.
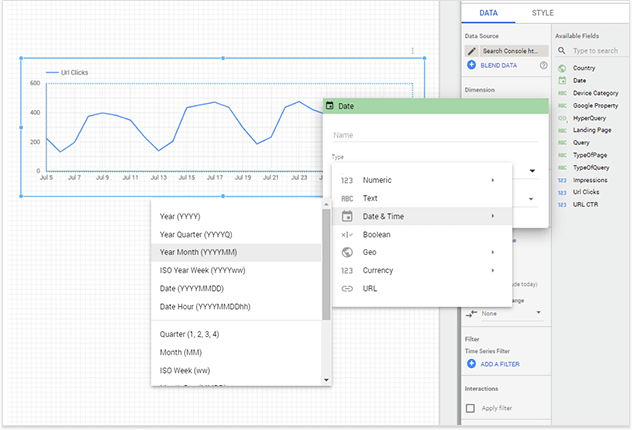
The tables and charts above show the static data. But this view doesn't show the traffic at runtime. So let's create a couple of charts to compare the data within different periods. In this example, I will compare the data for July 2019 to July 2018.
Now we can see the traffic changes at runtime for different types of pages and queries. In case your site experiences a traffic drop, you'll immediately know where performance has worsened.
Comparing a website's ranks against those of the competitorsWe can also create a chart that shows how the website's average rank changed compared to the competitors.
I exported the data for a short period, so my graph lacks information. If you have saved historic data for a longer period, your chart will look much more interesting.
Google Analytics doesn't provide information about keywords that lead to conversions. This data is hidden behind (not set)/(not provided) signs. This is very bad for you as an SEO, as you can't see which of your keywords bring not only traffic but also conversions. Obviously, the latter is more useful for an SEO campaign.
However, if we analyze the Analytics data combined with the data from Search Console, for example, we may suggest which keywords convert. Here's the data that, when mixed the right way, may help disclose a few secrets:
Let's merge this data into a single table. It will contain all search queries that had more than one click leading to a certain page. It will also include the data about conversions that occurred on a certain page the same day. This will let us very likely define what search query resulted in a conversion. (Yes, it's still a probability, but this method suits any project, and after all, it's free.)
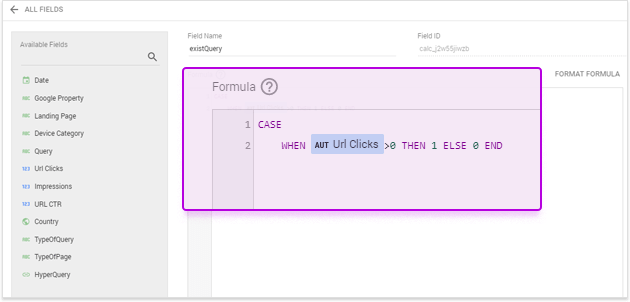
Use the following formula:
CASE

WHEN URL Clicks>0 THEN 1

ELSE 0

END
Use the following formula:
 CASE

WHEN SignUPGoals >0 THEN 1 ELSE 0

END
For Google Analytics:
For Google Search Console:
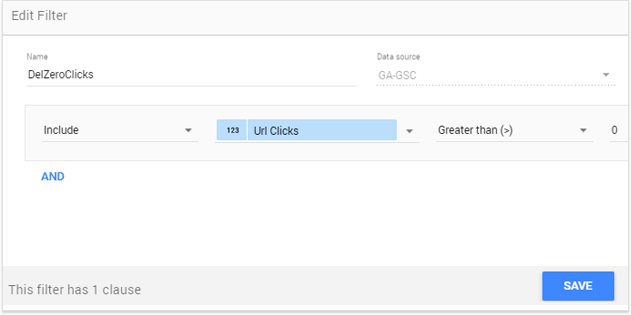
And set up a filter for Google Search Console:
Now, let's get to the table itself.
Row Dimensions
Column Dimensions
Metrics
Click Add metric> Create field. Name it ConversionRate and enter the following formula
SignUPGoals/URL Clicks+URL Clicks/SignUPGoals)/100*existGoalComplete
Sorting Row #1
Thus, we can see the number of conversions for each keyword. Again, as the table comprises a huge amount of data, it's better to filter it and analyze the data on a page level.
If we add the third data source to the blend we use in this table, we'll see the average page's position for a keyword. This will also help assess keywords' conversion potential.
For example, find keywords that don't convert even though you rank very well and have lots of your page impressions for them. This might mean that either you target the wrong keywords, or your pages lack something that makes users convert. So you'll easily see the areas you need to improve.
Row Dimensions
Column Dimensions
Metrics
Sorting Row #1
Filter
Don't forget to add the necessary filters to be able to analyze the data more conveniently, page-by-page.
Let's take a closer look at the columns and what exactly they show. I intentionally provided the results for one page and filtered the data to simplify the explanation.
Analyzing this data set, I found out that the site's homepage receives 90% of traffic from branded keywords. And this traffic converts quite well.
Here's an example of another page analysis. It is a blog publication. And though the page appears in search for many keywords, none of them resulted in a conversion.
The surprise, however, came as I extended the period under review. I managed to find a couple of search queries that converted on this page. And they were quite unexpected.
So, the bigger the period you analyze, the more likely you'll find something useful.
Reporting is an important part of an SEO campaign. Keeping all the interests informed may require a lot of effort. So the possibility to easily share a single report with the involved team members would be of great help.
Sharing access to tables and dashboards in Data Studio is very similar to that in Google Docs. It can be done through shareable links or email invitations. You may grant different rights to team members making them able either to view or edit the dashboard's contents.
In all my examples, I used Rank Tracker, as one of the data sources. However, you may add the needed data from any other SEO PowerSuite tools to Data Studio dashboards.
Download SEO PowerSuiteWhat's so great about Data Studio? Despite several limitations, it's a great data visualization and analytics tool. Combining different data sets in different variations may help you see a bigger picture of your project and gives you lots of useful insights. It can save you the time you'd otherwise spent on analyzing data in different tools separately and creating separate reports for each. Moreover, it's free, and I believe it's going to develop more functionality in due time.
| Linking websites | N/A |
| Backlinks | N/A |
| InLink Rank | N/A |